Listen first.
Diagnose
We don't make recommendations until we understand where you are. The baseline isn't a side step. It's the foundation everything else stands on.
Services
Nine stages, three buckets, one written report at every step. Transformations succeed when discovery is honest, decisions are defensible, and adoption is taken seriously.
McKinsey, Bain & Company, 2024
Projects meeting objectives
Our methodology
Modular by design. Enter at any stage, stop at any stage. Each one produces a written deliverable that stands on its own. Click any bucket name below to jump to its detail.
We don't make recommendations until we understand where you are. The baseline isn't a side step. It's the foundation everything else stands on.
A strategy without a roadmap is a wish. A roadmap without a business case is a hope. We turn understanding into a plan your board can sign off on.
Most transformations die at adoption, not at launch. We don't disappear at go-live. We stay until the value shows up and confirm it did.
Modular
Run one stage, sequence several, or work through the whole pipeline. Stop whenever the rest doesn't apply.
Written, not slides
Every stage produces a real report. Built to be read by people who weren't in the room and to hold up six months later.
Cited and independent
Recommendations grounded in primary research. No vendor commissions. The recommendation is yours.
01 · Listen first.
We don't make recommendations until we understand where you are. The baseline isn't a side step. It's the foundation everything else stands on.
Most companies use only 29% of the KPIs they define. Diagnostics produce data nobody acts on.
An honest written diagnostic of where your organization actually stands. Your specific situation, not a generic maturity model.
Maturity assessment across six axes
So we're not making recommendations from a generic playbook.
Industry and size-band benchmarking
Where you actually stand against your real peers, not a global enterprise average.
Percentile context against peer cohort
A 3 of 5 score means very different things at 50 people and at 500.
Gap analysis and prioritized opportunities
What to tackle first, ranked by realistic impact and cost.
90-minute written readout session
Walk-through plus pushback. The session is where the diagnostic earns its keep.
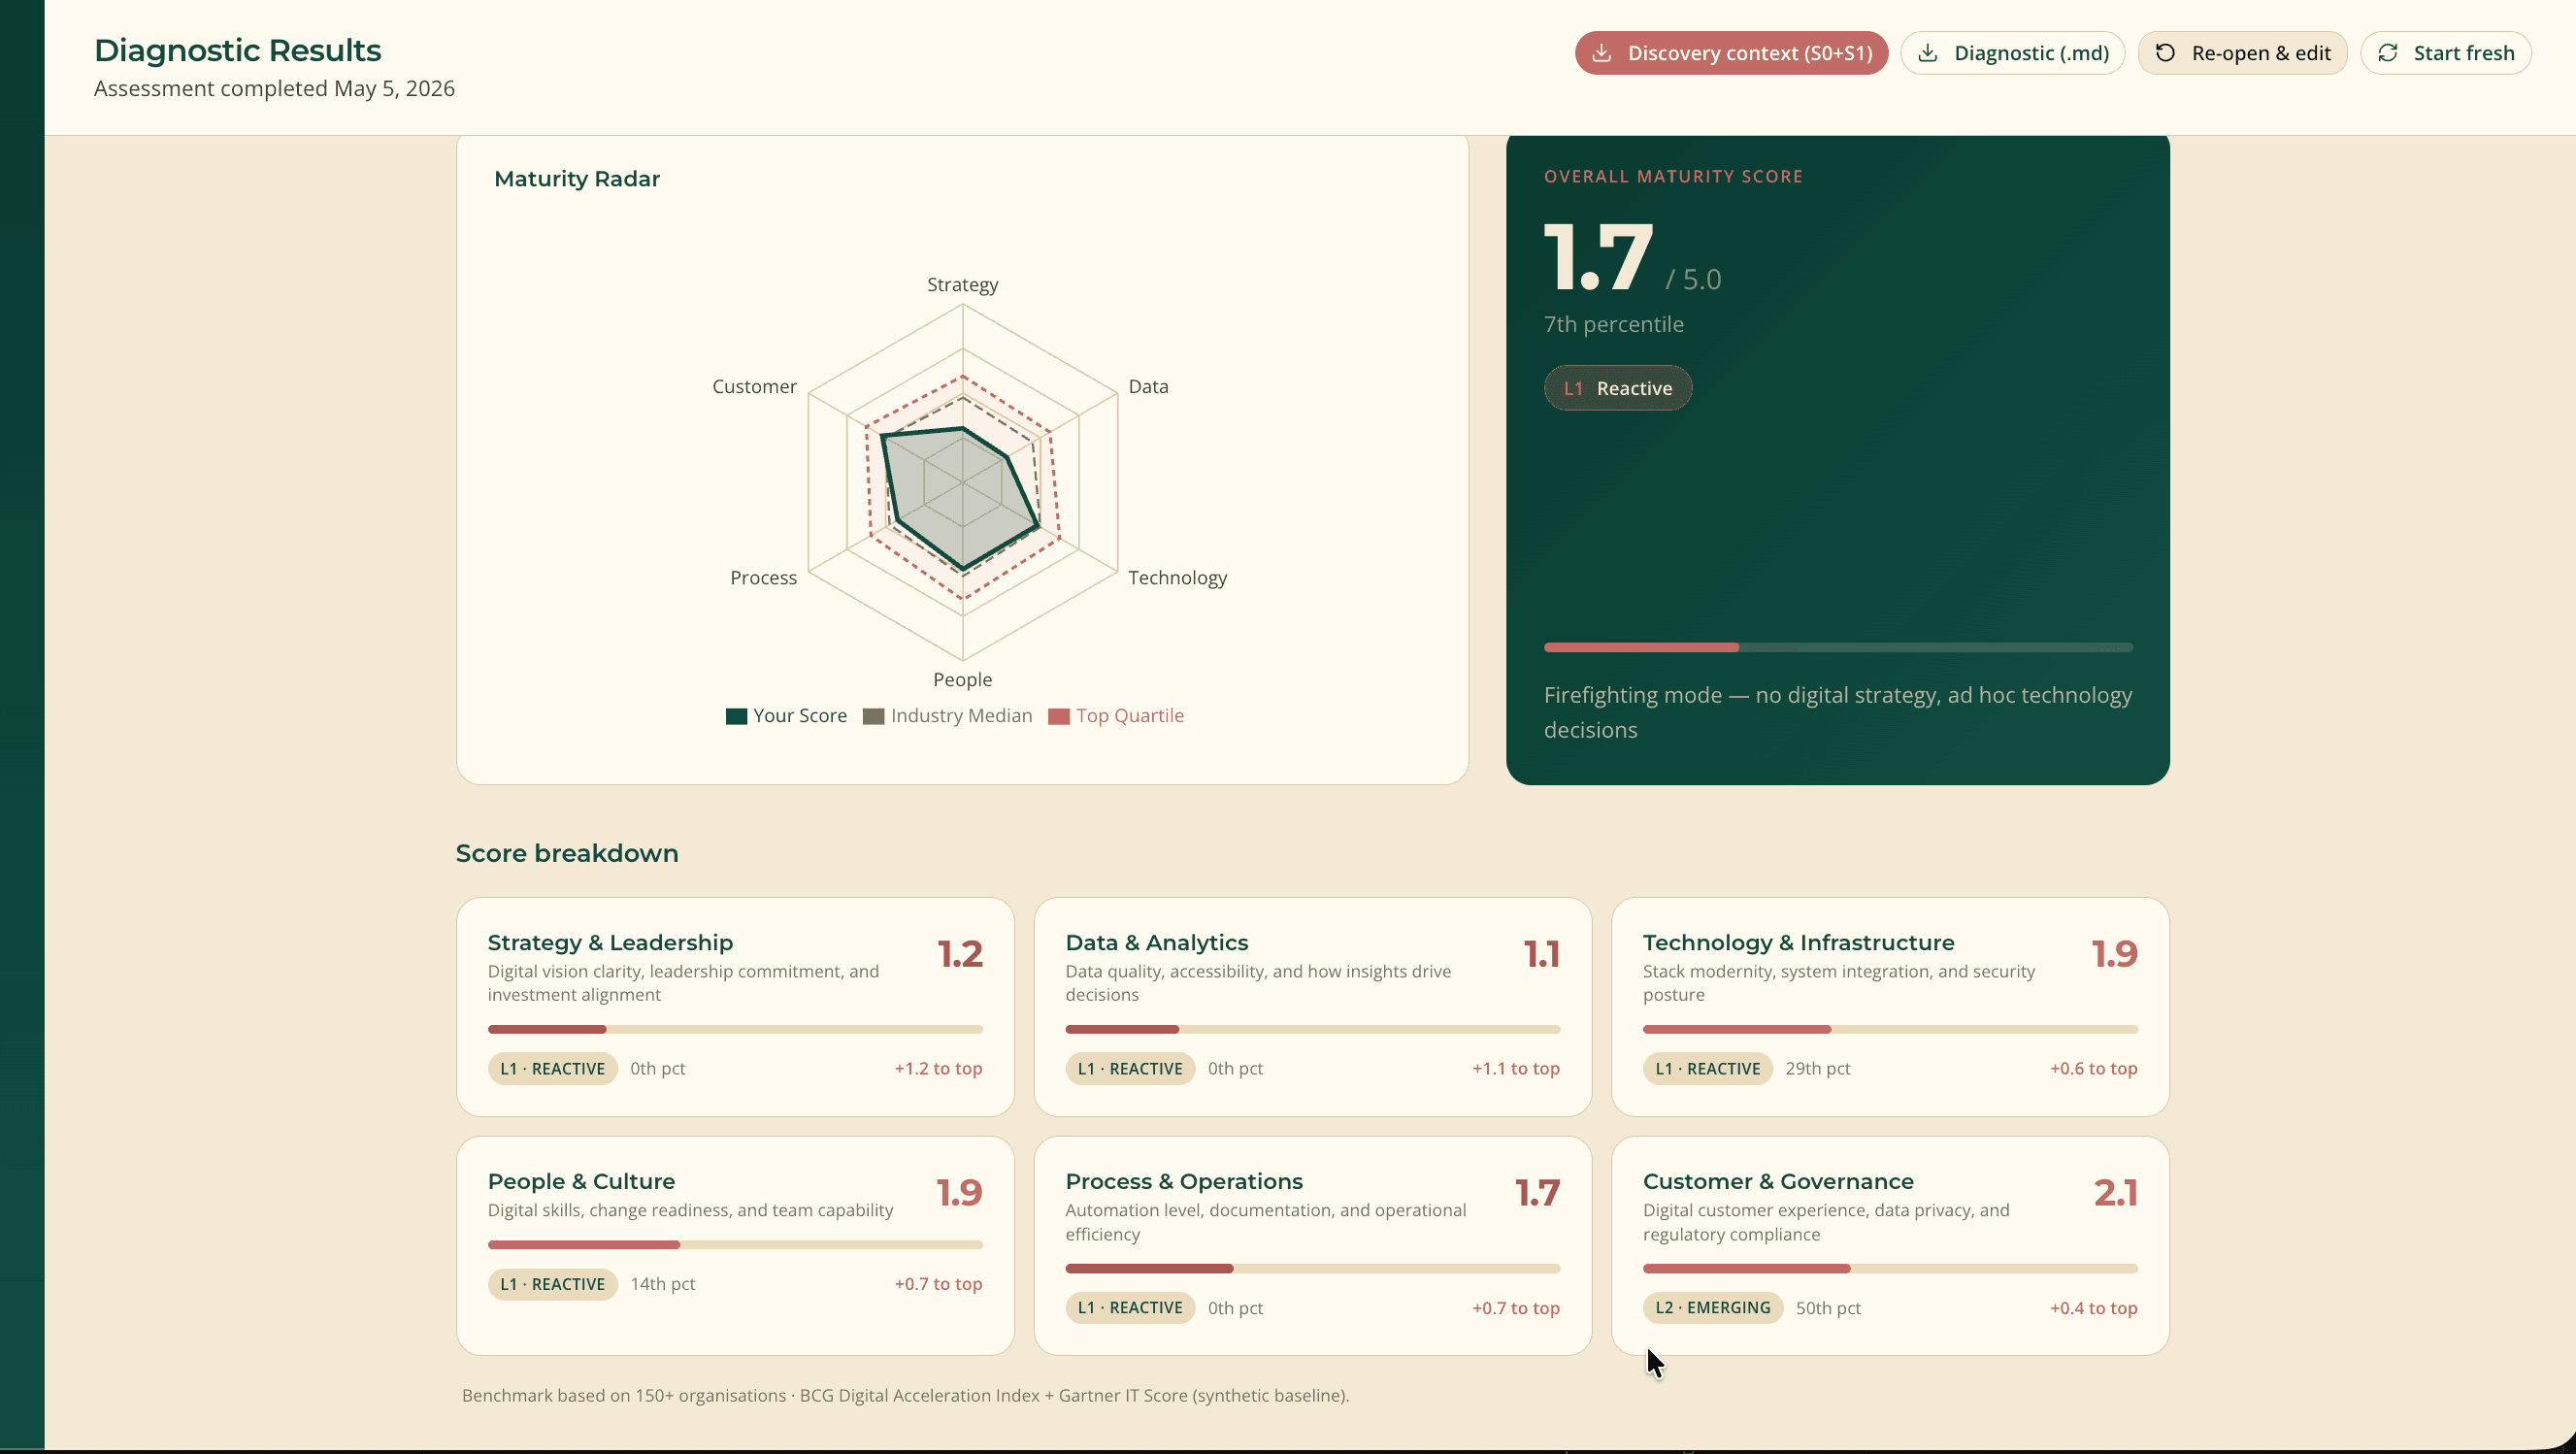
12-page maturity report
Radar charts · Industry benchmarking · Gap analysis
Decisions grounded in what your customers actually say, not what you assume. Synthesized from interviews, surveys, and support data.
Customer interview design and conduct
Real conversations, not surveys nobody fills out honestly.
Survey and support data synthesis
Whatever you already have gets pulled into one view.
Persona definitions tied to revenue impact
Personas that matter to the P&L, beyond the marketing view.
Top customer themes with verbatim quotes
Quotes carry more weight in a board meeting than a paraphrase.
Implications for strategy and roadmap
What you should actually do differently because of what we heard.
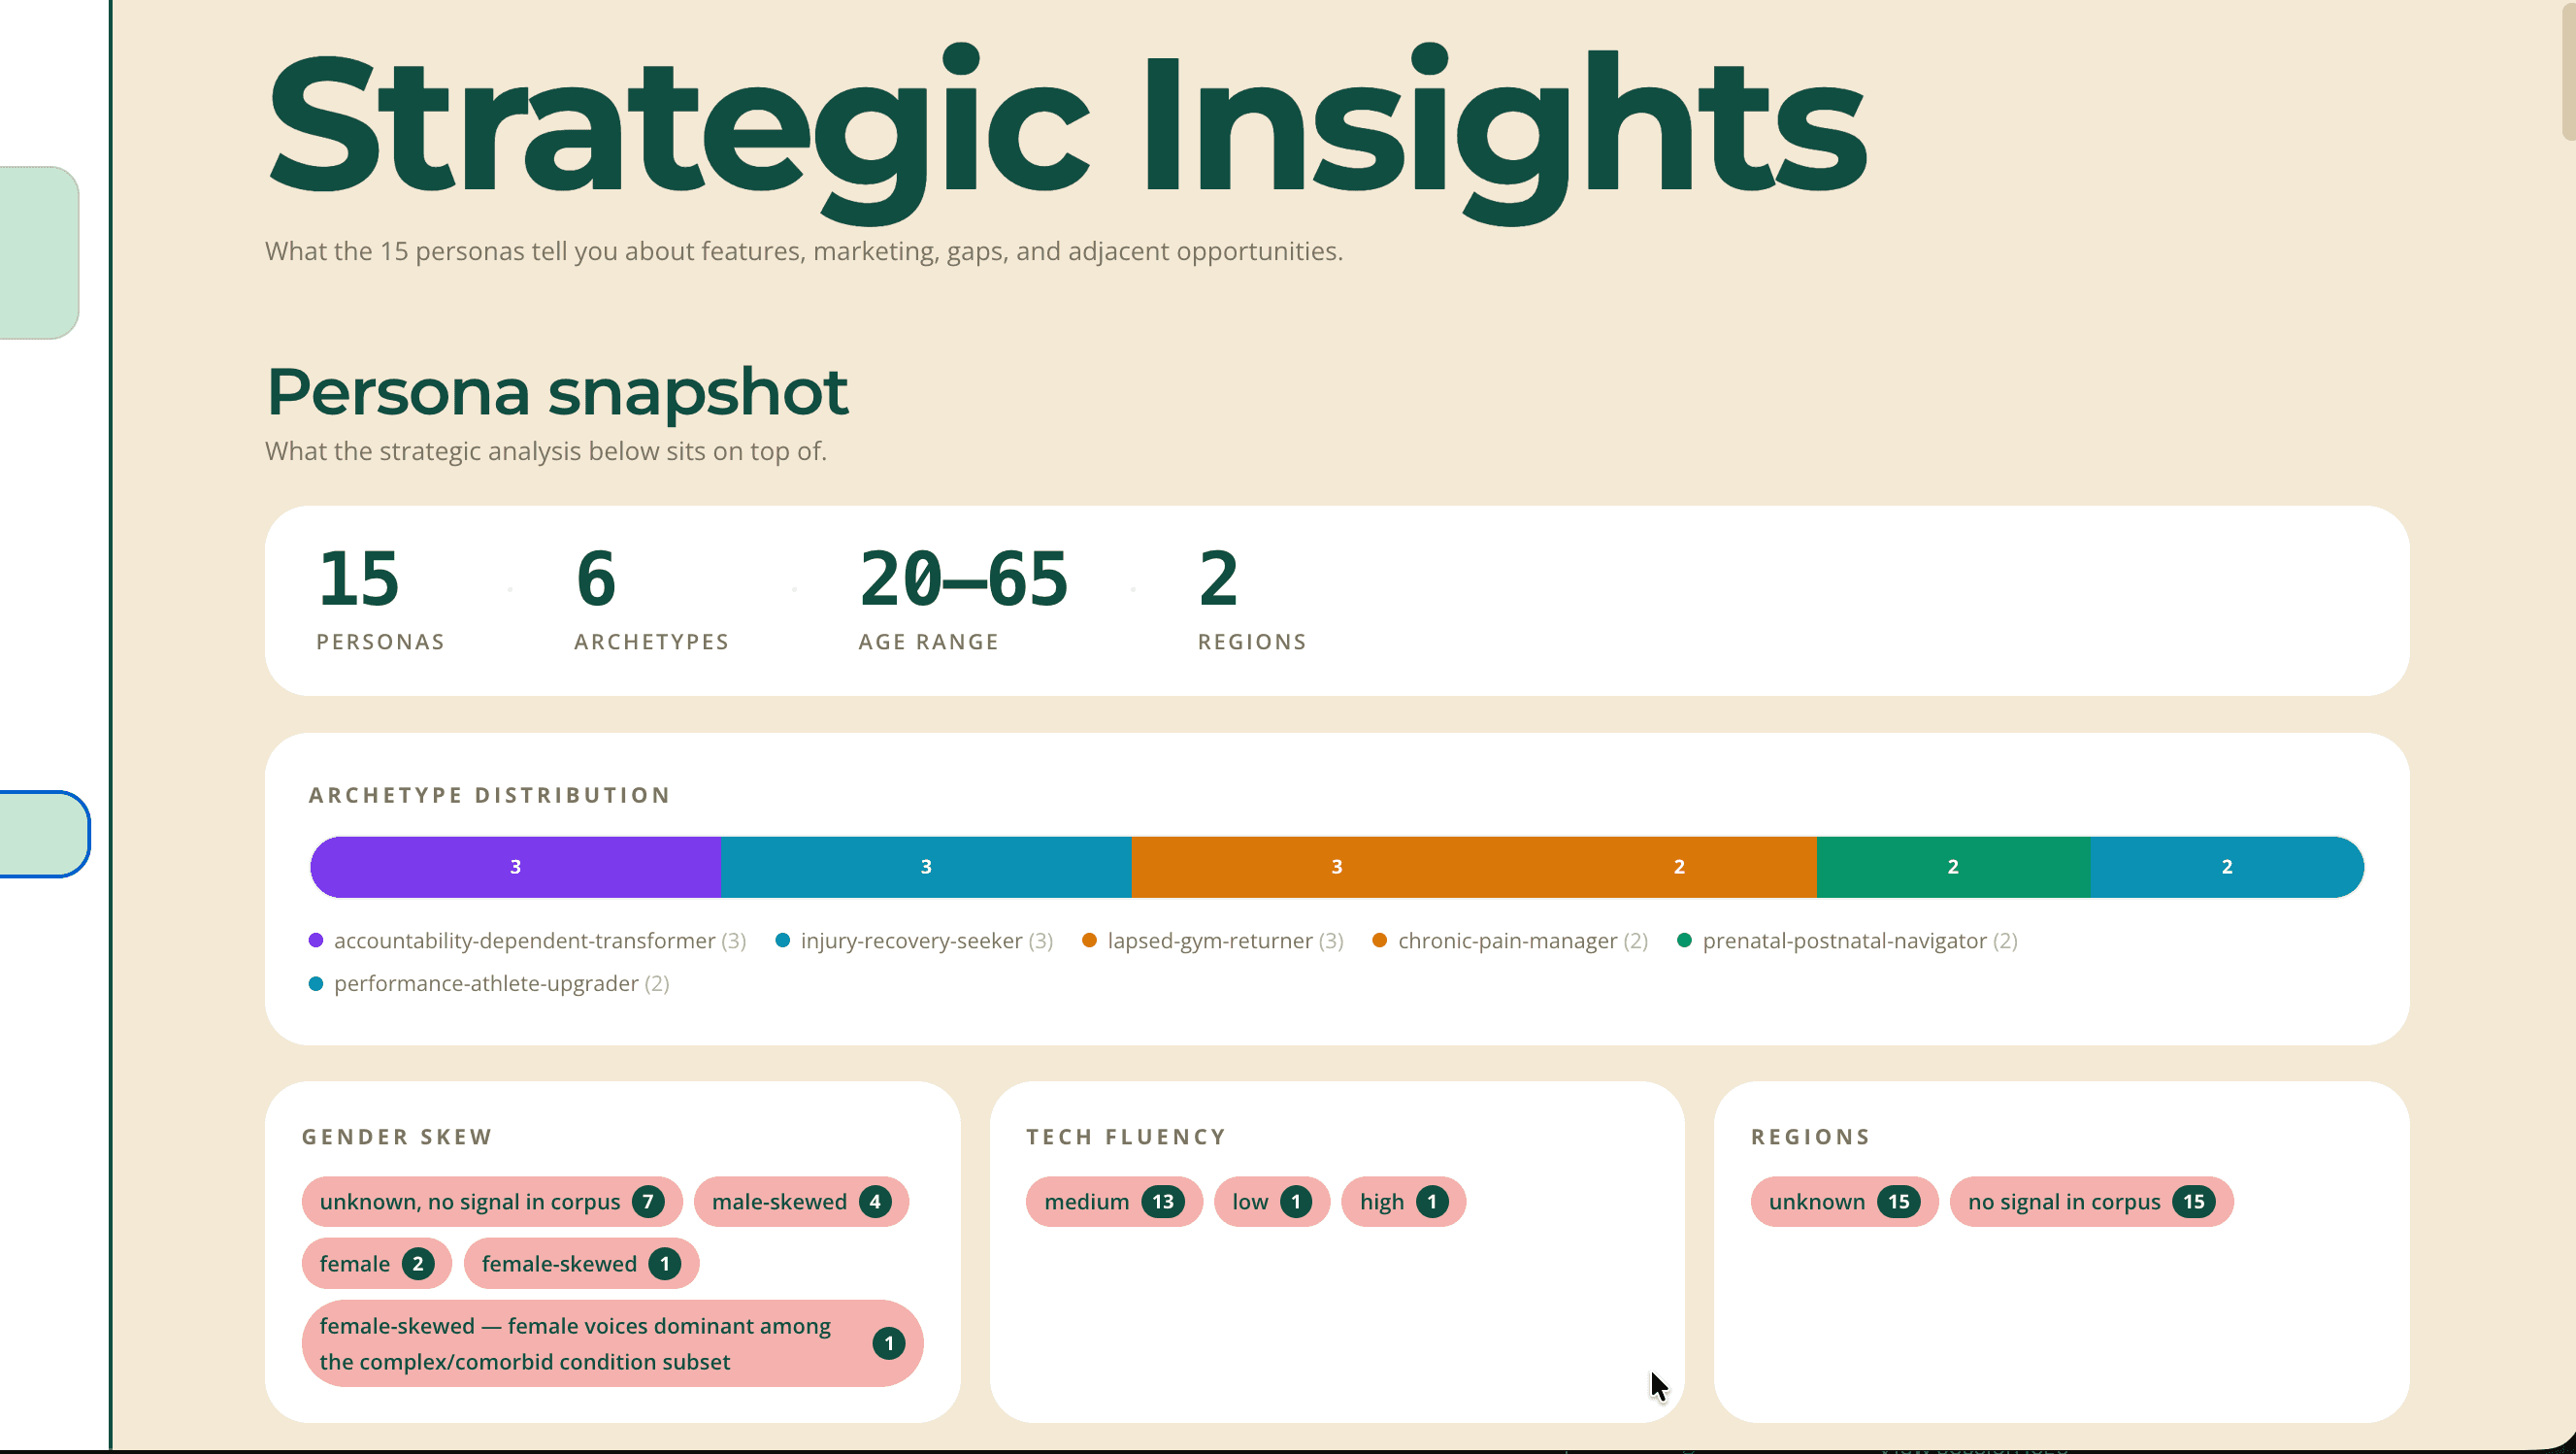
Voice-of-customer synthesis
Personas · Themes · Verbatims
“Customer-obsessed B2B companies grow revenue 28% faster.”
And they retain customers 43% better. Yet only 3% of companies qualify as customer-obsessed. Discovery is where most strategies leak credibility.
02 · Plan with rigour.
A strategy without a roadmap is a wish. A roadmap without a business case is a hope. We turn understanding into a plan your board can sign off on.
67% of well-formulated strategies fail because of poor execution. The gap is in translation, not formulation.
A written strategy your team can act on Monday. Not a slide deck that ends up in a drawer.
Vision and strategic principles
The handful of beliefs that should guide every downstream decision.
Competitive position analysis
Where you actually win and where you're just adequate.
Target customer and value proposition
Who you're for and what you do for them. Specific.
Strategic priorities with measurable goals
Three to five priorities, each with a number against it.
KPI dashboard design
How you'll know if the strategy is working without waiting twelve months.
Six or more chart visualizations
Charts that survive a board deck and a year of decisions.
Strategy report
~40 pages · 6+ charts · written, not slides
A sequenced 6, 12, and 18-month plan with the trade-offs visible. You see what to build, what to defer, and why.
Initiative backlog scored on effort and impact
Every idea on the table gets a fair scoring, including the quiet ones.
Prioritization matrix with named trade-offs
What we're saying yes to, what we're saying not-yet, and why.
Three-horizon timeline view
Six months, twelve months, eighteen months. So you can plan budget against it.
Dependency and risk map
What needs to happen first, and what could derail any of it.
Resource and budget plan
How much it costs and who actually does the work.
Named quick wins for the first 90 days
Real momentum in the first quarter so the program doesn't stall.
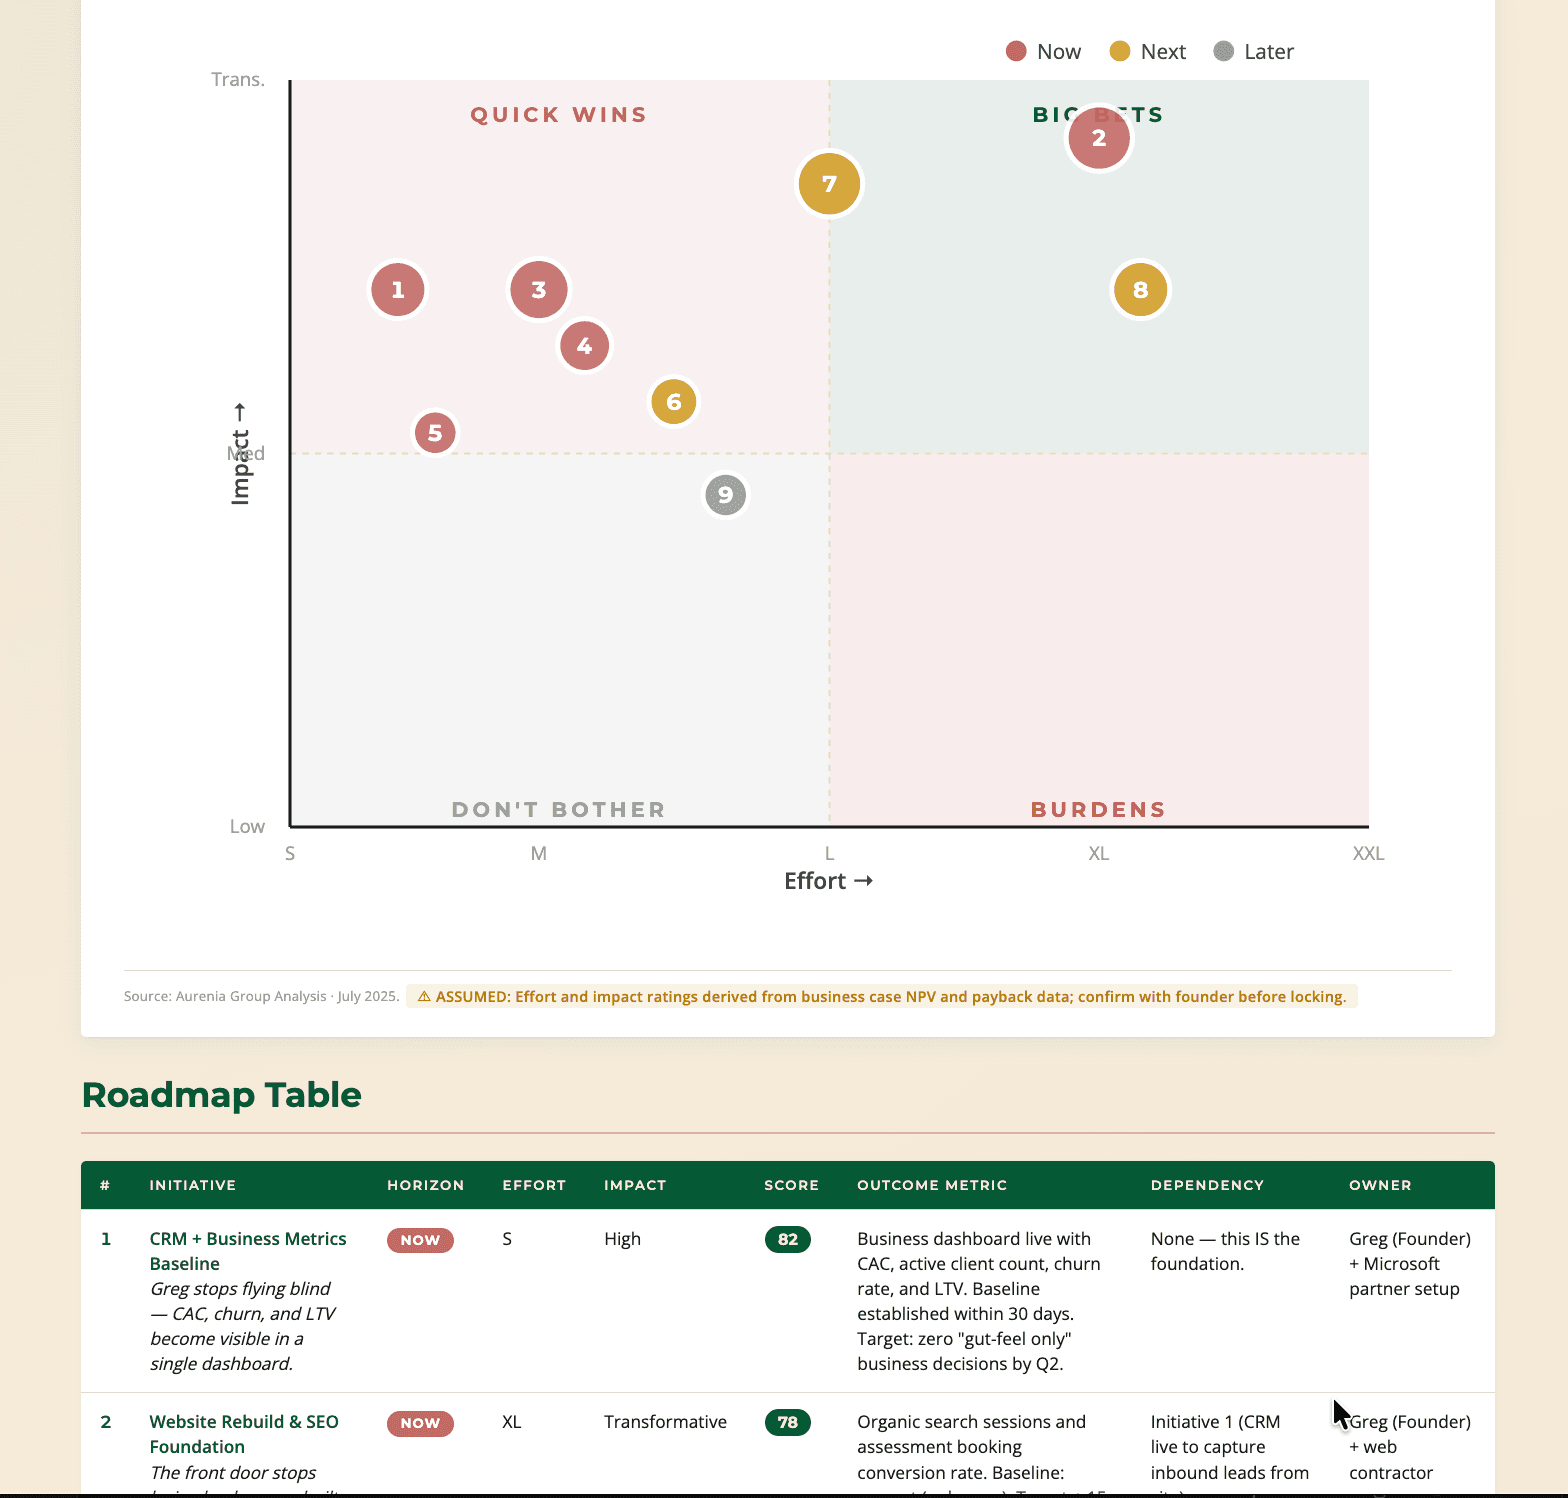
Roadmap report
Effort × impact 2×2 · Horizon timeline · Dependency map
ROI math, total cost, and risk register in plain language. Board-ready, written to win budget approval, including grants where they apply.
Cost model with documented assumptions
Every dollar traceable to an assumption your CFO can sanity-check.
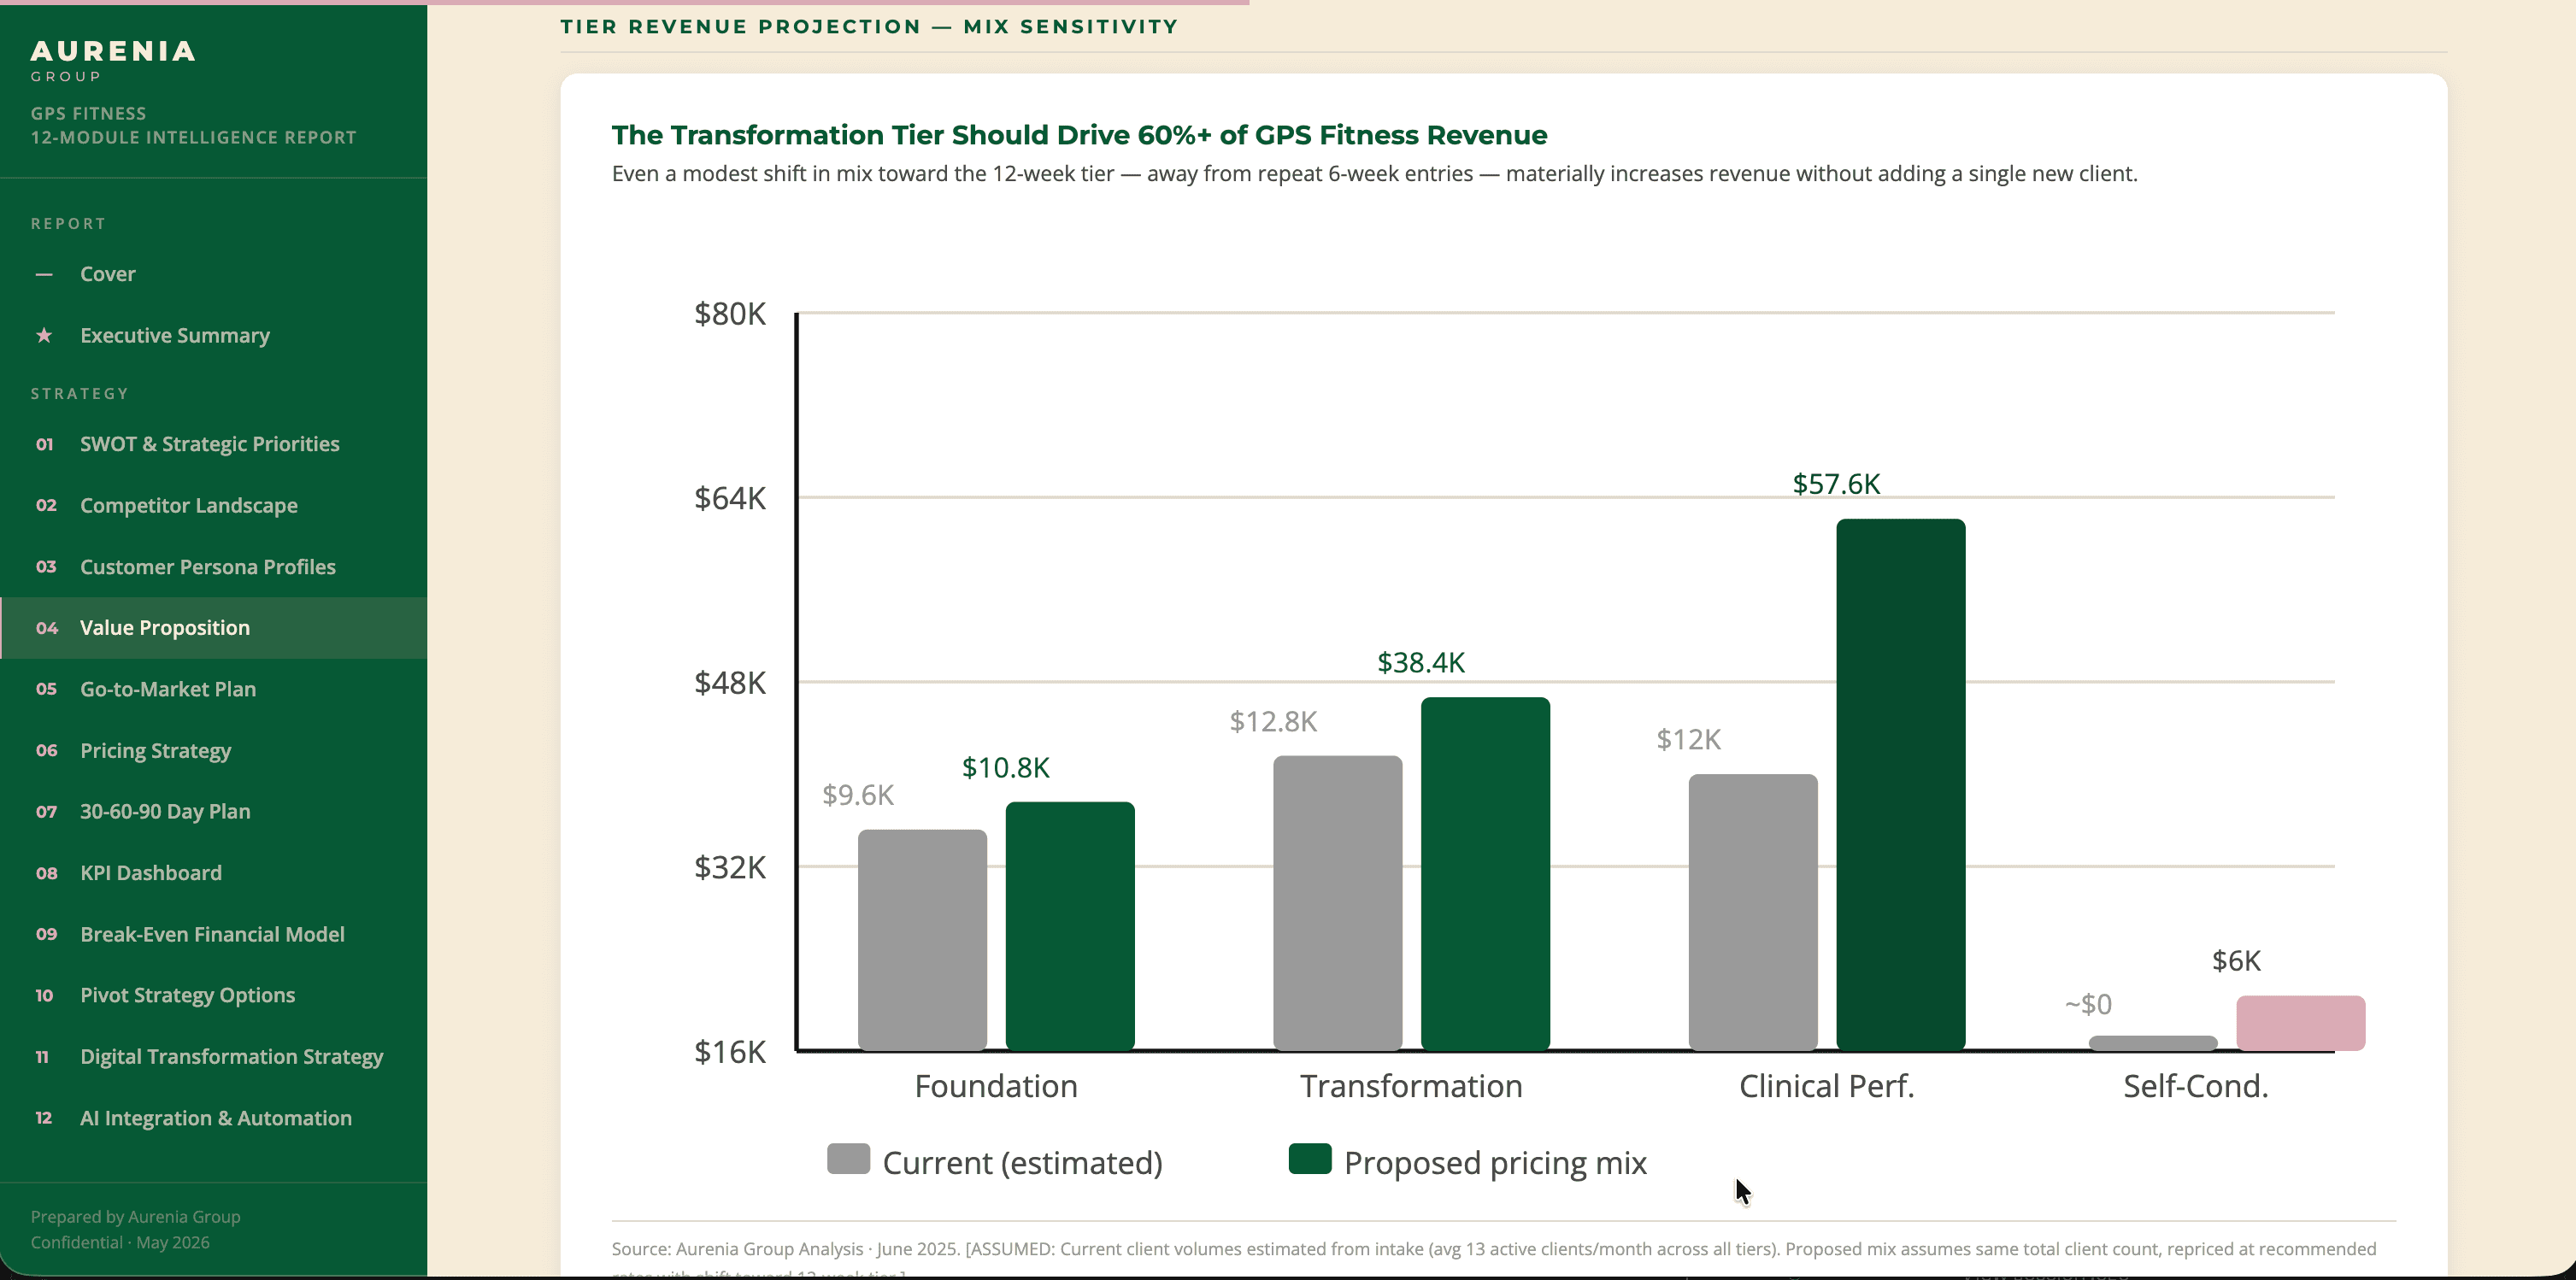
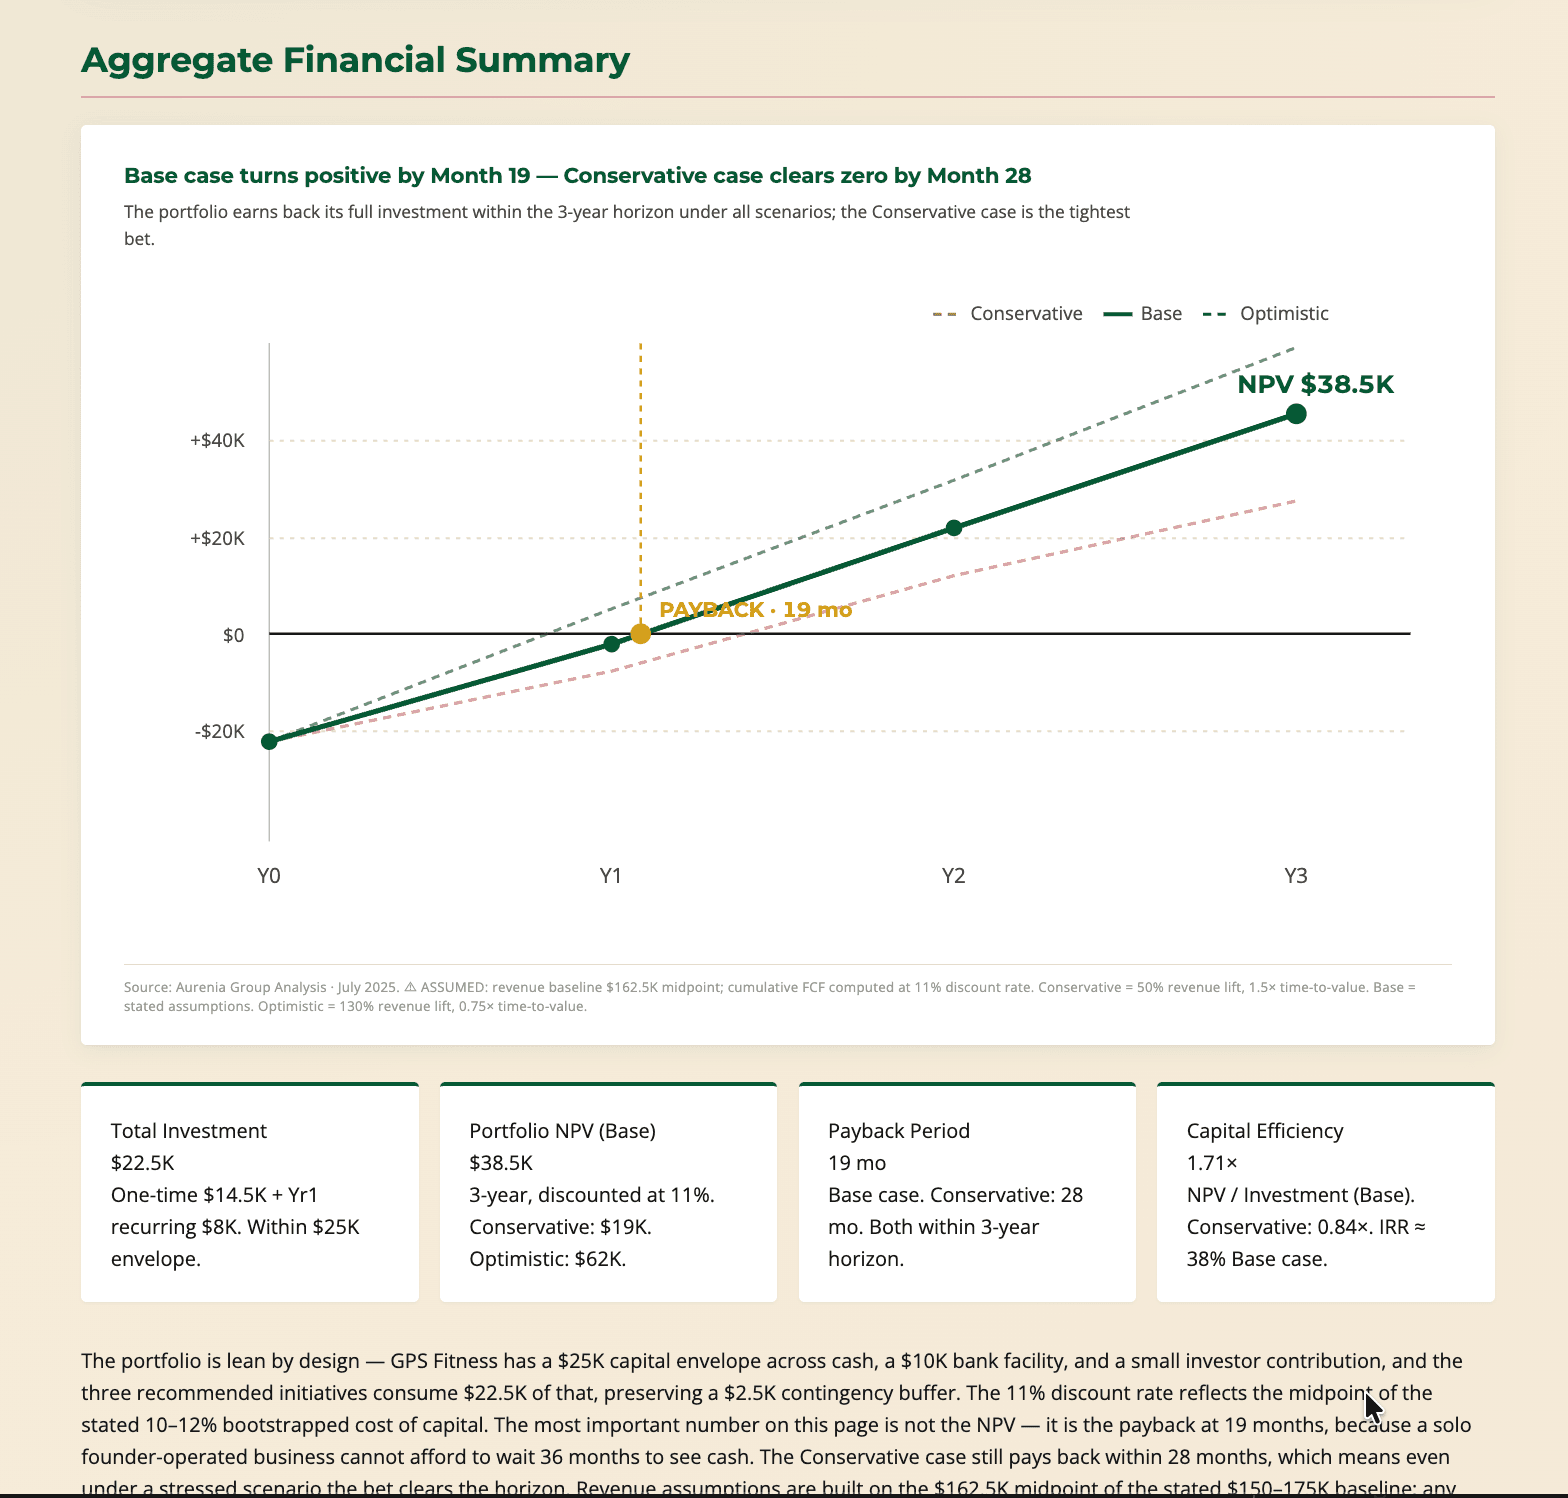
Three-scenario revenue or savings model
Conservative, expected, optimistic. Honest about the range.
Sensitivity analysis on key drivers
Which inputs matter most and which are noise.
Cumulative ROI projection over 36 months
When you actually break even and what the steady-state looks like.
Risk register with mitigations
Named, ranked, with mitigation plans. Nothing hidden.
Atlantic Canada funding-source recommendations
Which grants and tax credits realistically apply to your project.
Business case report
Scenario bars · Sensitivity tornado · Cumulative ROI
An honest build-vs-buy analysis and vendor short-list, picked for fit. We don't take vendor commissions, so the recommendation is yours.
Build-vs-buy analysis
Honest answer about when buying off-the-shelf wins and when building in-house is worth it.
Vendor long-list and short-list
We surface vendors you've never heard of when they fit better than the obvious one.
Scored evaluation: functional, commercial, risk
All three together. A great fit at the wrong price isn't a great fit.
Reference architecture diagram
How the pieces will actually connect. Engineers can build from this.
Contract and lock-in risk register
What happens in year three if you want to switch.
Negotiation positioning notes
What to ask for, where vendors usually flex, what to walk away from.
Sample Deliverable
Vendor selection package
Scored comparison · Risk register · Reference architecture
“Large IT projects deliver 56% less value than predicted.”
They also run 45% over budget. Disciplined business cases, with named risks, sensitivity analysis, and explicit ROI, are one of four predictors of top-quartile transformation outcomes.
03 · Ship and prove it.
Most transformations die at adoption, not at launch. We don't disappear at go-live. We stay until the value shows up and confirm it did.
Adoption and usage of a delivered solution generates 73% of the expected project value.
We orchestrate the build with hand-picked partners. You stay close to the work without managing three vendors yourself.
Functional and technical specification
Detailed enough that any partner can build to it without surprises.
Partner selection and contracting
We've worked with the build partners we recommend. We know who actually delivers.
Sprint plan with milestone gates
Real checkpoints where we agree what's done before paying for the next sprint.
Weekly build review and risk tracking
Issues surfaced when they're cheap to fix, not at launch.
QA and acceptance testing
Tested by the people who'll actually use it, alongside the developers.
Launch readiness checklist
Nothing forgotten. Including the boring things that take down launches.
Sample Deliverable
Working MVP + project plan
Sprint plan · Partner orchestration · QA gates
Adoption is where most transformations die. We design rollout, training, and feedback loops so the new way actually gets used.
Stakeholder map and resistance plan
Who needs to be on board, who's on the fence, and how we'll address the skeptics.
Phased rollout schedule
Pilots first, then expansion, so problems get caught before they're at full scale.
Role-based training curriculum
Different roles need different training. Generic LMS content doesn't cut it.
Internal communications kit
Pre-written announcements, FAQs, and updates. Saves your team weeks of drafting.
Feedback collection mechanism
How we hear what's not working in week two so we can fix it by week four.
Adoption KPIs and dashboards
Adoption numbers your CEO actually trusts, with drill-downs by team.
Sample Deliverable
Adoption plan + training
Rollout plan · Training curriculum · Feedback loops
90, 180, and 365-day check-ins to confirm the value showed up, and to course-correct if it didn't.
Baseline vs. target KPI dashboards
Where you started, where you're going, and where you actually are right now.
Variance analysis at 90, 180, 365 days
Three checkpoints to course-correct before the year is gone.
Quarterly course-correction reviews
If something isn't working, we change it. Not at the end of the year.
ROI realization report
Whether the investment paid off, with the numbers laid out so the next budget conversation is easy.
Lessons-learned synthesis
What worked, what didn't, what we'd do differently. Banked for the next initiative.
Next-cycle prioritization input
What to tackle next, informed by what you actually learned this cycle.
Sample Deliverable
Value tracking dashboard
KPI tracking · Variance analysis · Quarterly reviews
“More than 80% of organizations report no tangible EBIT impact from generative AI.”
The gap isn't adoption, it's value capture. Stage 9 is the difference between "we deployed it" and "it paid off."
Track record
Aurenia brings to Atlantic Canada the kind of operating, transformation, and analytics experience usually reserved for national engagements. Built across brewing, manufacturing, healthcare, retail, and financial services.


How we work together
A single stage with a defined deliverable. Best for a specific question or report.
Days to a few weeks
A sequenced run through several stages, scoped one at a time. Typical paths are Diagnose to Decide, or Decide to Deliver.
A few weeks per stage
Ongoing strategic support after a transformation has shipped. Monthly hours, quarterly reviews.
Monthly, quarter-to-quarter
Built for this region
Halifax tech workforce growth in three years. Ranked #2 emerging tech market in North America.
of small Canadian firms cite skill shortages as a top barrier. Most don't have an internal team to lead transformation.
Common questions
Book a free 30-minute discovery call. We'll talk through where you are, where you want to be, and where we'd start. No pitch, no pressure, just a useful conversation.